This topic deals with studying changes in mechanical properties of cells when mutations are present in a cytoskeletal protein involved in muscle disease. This can help understanding fundamental mechanisms that drive to weakness at muscle scale.
Myoblasts are the early cells that form muscle. Their mechanics is mainly determined by the cytoskeleton, which consists of three types of polymeric filaments : actin, microtubules and intermediate filaments (IF).
Elastic properties of cells are usually derived from the actin cytoskeleton. But, intermediate filaments are emerging as major contributors to the mechanical properties of cells. For example, desminopathies (desmin being a muscle-specific IF) are diseases affecting cardiac and skeletal muscles, caused by a mutation in the desmin gene. Patients with desmin mutation present severe lower limb muscle weakness and heart and respiratory failure.
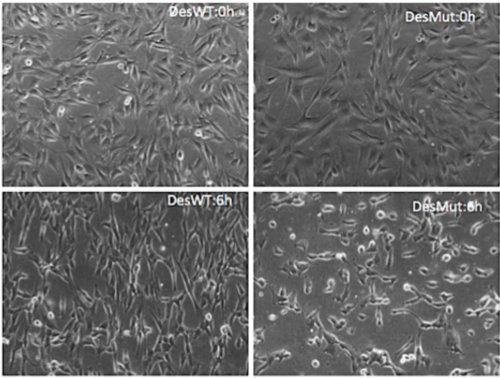
Studying isolated myoblast cells revealed a highly aggregative behavior of transfected cells overexpressing desmin in response to external stress such as oxidative or heat-shock stress in C2C12 myoblasts (Segard 2013). In (Leccia 2013), we showed that the dynamics and shape of desmin-mutated myoblasts are altered when submitted to cyclic stretch.
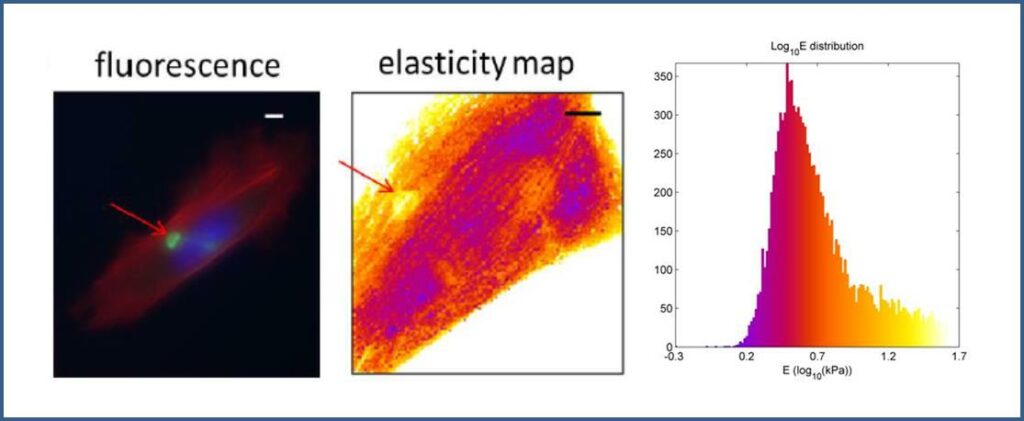
(Even 2017) used Atomic Force Microscopy and showed that the presence of aggregates of D399Y-desmin locally increases the mutated cells rigidity. This demonstrates that D399Y mutation in desmin stiffens myoblasts and suggests that D399Y related myofibrillar myopathy is at least partly due to altered mechanical properties at the single-cell scale, which are propagated to the whole tissue.